QUBIT AI: Infratonal
Useless Hands
FILE 2024 | Aesthetic Synthetics
International Electronic Language Festival
Infratonal – Useless Hands – France
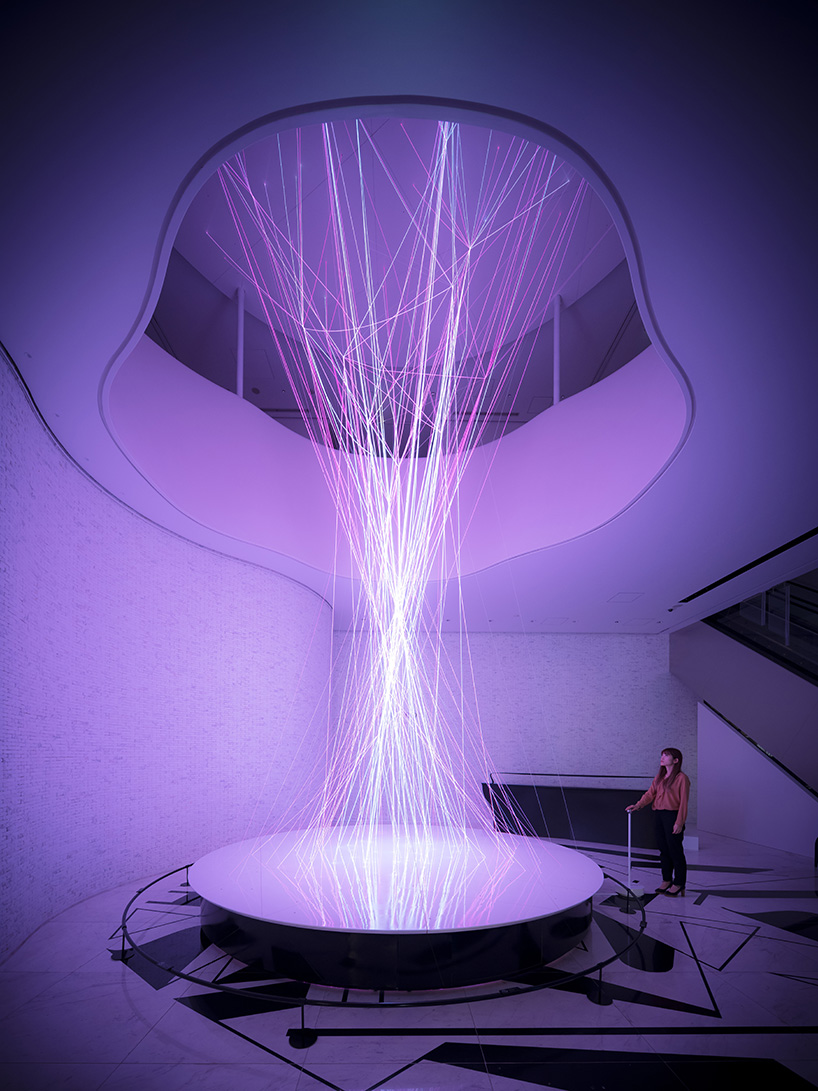
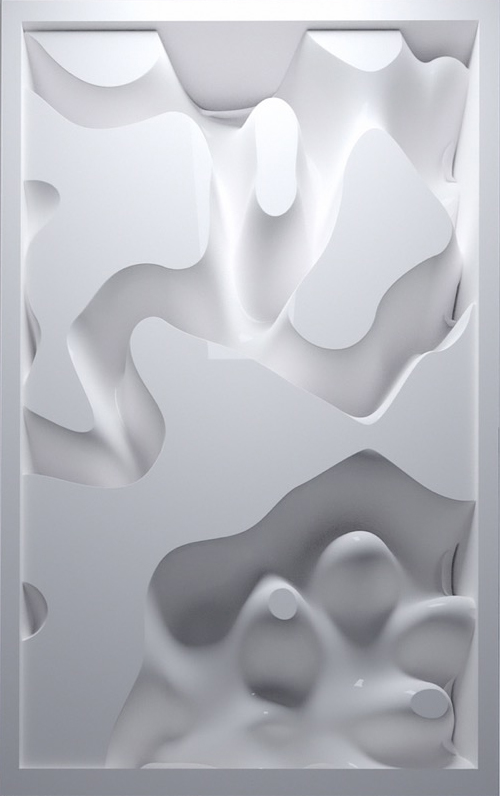
When our hands become useless, what will we choose to do with them? We can use AI to visualize the unthinkable, the strangely familiar yet indescribable forms and structures. Generative AI could be used as an amplifier of our ability to explore abstraction and surrealism rather than a simple mirror of our usual perceptions.
Bio
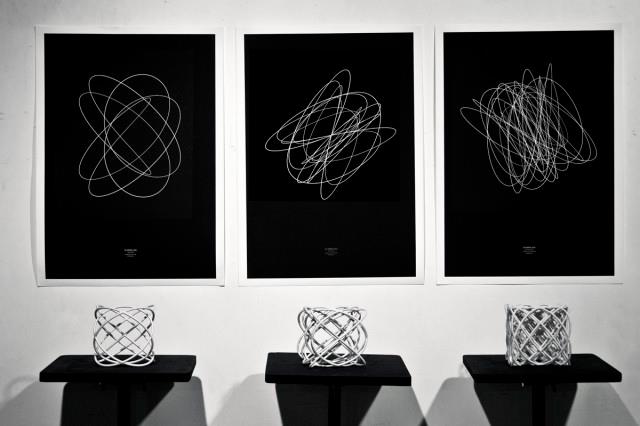
Infratonal is an artistic project led by Louk Amidou, a Paris-based multidisciplinary artist who works at the intersection of digital arts, electronic music and interaction design. He uses algorithms to create hybrid visual and sound pieces which aim to be performed by the human gesture as intangible instruments. He questions the artwork’s nature at the age of AI and the relationship between the artist and the algorithm.